

U.S. Flu Activity Report for Week Ending May 12 (Week 19)
submited by wanglh at May, 26, 2007 10:7 AM from CDC
Synopsis:
During week 19 (May 6 ? 12, 2007)*, influenza activity continued to decrease in the United States. Data from the U.S. World Health Organization (WHO) and National Respiratory and Enteric Virus Surveillance System (NREVSS) collaborating laboratories indicated a decrease in the number of specimens testing positive for influenza. The percentage of visits for ILI to sentinel providers remained at similar levels during week 19 compared to week 18 and was below the national baseline for the eighth consecutive week. One state reported local influenza activity; the District of Columbia, New York City, and 30 states reported sporadic influenza activity; and 19 states reported no influenza activity. The percent of deaths due to pneumonia and influenza has remained below baseline levels for the entire influenza season to date.
Laboratory Surveillance*:
During week 19, WHO and NREVSS laboratories reported 1,014 specimens tested for influenza viruses, 76 (7.5%) of which were positive: three influenza A (H1) viruses, 23 influenza A (H3) viruses, 32 influenza A viruses that were not subtyped, and 18 influenza B viruses.
Since October 1, 2006, WHO and NREVSS laboratories have tested a total of 170,452 specimens for influenza viruses and 23,009 (13.5%) were positive. Among the 23,009 influenza viruses, 18,256 (79.3%) were influenza A viruses and 4,753 (20.7%) were influenza B viruses. Six thousand thirty-five (33.1%) of the 18,256 influenza A viruses have been subtyped: 3,847 (63.7%) were influenza A (H1) viruses and 2,188 (36.3%) were influenza A (H3) viruses. While influenza A (H1) viruses were predominant this season, overall influenza A (H3) viruses have been reported more frequently than influenza (H1) viruses since early March. Among specimens tested for influenza during the most recent three weeks (April 22 ? May 12, 2007), on a regional basis, only the Mid-Atlantic, South Atlantic, and Pacific regions reported >10% of specimens testing positive.
View WHO-NREVSS Regional Bar Charts | View Chart Data |ViewFull Screen
Composition of the 2006-07 Influenza Vaccine:
WHO has recommended that the 2007-08 trivalent influenza vaccine for the Northern Hemisphere contain A/Solomon Islands/3/2006-like (H1N1), A/Wisconsin/67/2005-like (H3N2), and B/Malaysia/2506/2004-like viruses. The influenza A (H1N1) component has been changed from the 2006-07 season vaccine components. A/Solomon Islands/3/2006 is a recent antigenic variant of the current vaccine strain A/New Caledonia/20/99. The influenza A (H3N2) and influenza B components remain the same. B/Ohio/1/2005 is antigenically equivalent to B/Malaysia/2506/2004. This recommendation was based on antigenic analyses of recently isolated influenza viruses, epidemiologic data, and post-vaccination serologic studies in humans.
Antigenic Characterization:
CDC has antigenically characterized 738 influenza viruses [358 influenza A (H1), 171 influenza A (H3) viruses, and 209 influenza B viruses] collected by U.S. laboratories since October 1, 2006.
Influenza A (H1) [358]? Three hundred thirty-one (92%) of the 358 viruses characterized were similar to A/New Caledonia/20/99-like, which is the influenza A (H1) component of the 2006-07 influenza vaccine.Influenza A (H3) [171]
? Twenty-six (7%) of the 358 viruses showed somewhat reduced titers with antisera produced against A/New Caledonia/20/99 and are similar to A/Solomon Islands/3/2006-like. A/Solomon Islands/3/2006 is a recent antigenic variant of A/New Caledonia/20/99.
? One virus showed somewhat reduced titers with antisera produced against A/New Caledonia/20/99 and to A/Solomon Islands/3/2006.? Forty-three (25%) of the 171 viruses were characterized as A/Wisconsin/67/2005-like, which is the influenza A (H3) component of the 2006-07 influenza vaccine.Influenza B (B/Victoria/02/87 and B/Yamagata/16/88 lineages) [209]
? One hundred and twenty-eight (75%) of the 171 viruses showed somewhat reduced titers with antisera produced against A/Wisconsin/67/2005. A proportion of the low-reacting isolates appear to be low avid viruses because they react poorly with all antisera, including antisera made against these low reacting viruses. This indicates that these are not true antigenic variants.Victoria lineage [159]
? One hundred and fifty-nine (76%) of the 209 influenza B viruses characterized belong to the B/Victoria lineage of viruses.o Eighty-five (53%) of these 159 viruses were similar to B/Ohio/01/2005, the B component of the 2006-07 influenza vaccine.Yamagata lineage [50]
o Seventy-four (47%) of these 159 viruses showed somewhat reduced titers with antisera produced against B/Ohio/01/2005.
? Fifty (24%) of the 209 influenza B viruses characterized belong to the B/Yamagata lineage of viruses. Pneumonia and Influenza (P&I) Mortality Surveillance*:
Pneumonia and Influenza Mortality Surveillance:
During week 19, 6.4% of all deaths were reported as due to pneumonia or influenza. This percentage is below the epidemic threshold of 7.2% for week 19.
Influenza-Associated Pediatric Mortality*:
Two influenza-associated pediatric deaths were reported during week 19. Since October 1, 2006, CDC has received 57 reports of influenza-associated pediatric deaths that occurred during the current season.
Influenza-Associated Pediatric Hospitalizations*:
Laboratory-confirmed influenza-associated pediatric hospitalizations are monitored in two population-based surveillance networks?: the Emerging Infections Program (EIP) and the New Vaccine Surveillance Network (NVSN).
During November 5, 2006 to April 28, 2007, the preliminary laboratory-confirmed influenza-associated hospitalization rate for children 0-4 years old in the NVSN was 3.02 per 10,000.
During October 1, 2006 to April 28, 2007, the preliminary laboratory-confirmed influenza-associated hospitalization rate reported by the EIP for children 0?17 years old was 0.81 per 10,000. For children aged 0-4 years and 5-17 years, the rate was 1.62 per 10,000 and 0.23 per 10,000, respectively.
Influenza-like Illness Surveillance*:
During week 19, 1.0%** of patient visits to U.S. sentinel providers were due to ILI. This percentage is below the national baseline*** of 2.1%. All nine surveillance regions**** reported ILI below their region-specific baseline***:
View SentinelProviders Regional Charts | ViewChart Data| View Full Screen
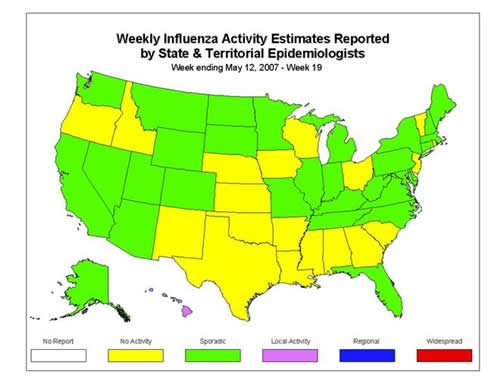
Influenza Activity as Assessed by State and Territorial Epidemiologists*:
During week 19, the following influenza activity?? was reported:
? Local activity was reported by one state (Hawaii).
? Sporadic activity was reported by the District of Columbia, New York City, and 30 states (Alaska, Arizona, California, Colorado, Connecticut, Delaware, Florida, Illinois, Indiana, Kentucky, Maine, Maryland, Massachusetts, Michigan, Minnesota, Missouri, Montana, Nevada, New Hampshire, New York, North Carolina, North Dakota, Pennsylvania, South Dakota, Tennessee, Utah, Virginia, Washington, West Virginia, and Wyoming).
? Alabama, Arkansas, Georgia, Idaho, Iowa, Kansas, Louisiana, Mississippi, Nebraska, New Jersey, New Mexico, Ohio, Oklahoma, Oregon, Rhode Island, South Carolina, Texas, Vermont, and Wisconsin reported no influenza activity.
- China: A human case of avian influenza A(H9N2) reported in Yunnan Province 2 days ago
- US: Highly Pathogenic Avian Influenza Detected in Texas Dairy Herd 5 days ago
- US: Dairy HPAI Detected in Cache County in Utah 6 days ago
- China: A human case of avian influenza A(H9N2) reported in Guangxi Zhuang Autonomous Region 8 days ago
- USDA: Confirms Highly Pathogenic Avian Influenza (H5N1) in a Dairy Herd in Idaho 13 days ago
[Go Top] [Close Window]