

U.S. Flu Activity Report for Week Ending Mar 17 (Week 11)
submited by pub4world at Apr, 1, 2007 1:29 AM from CDC
Synopsis:
: During week 11 (March 11 ? March 17, 2007)*, influenza activity continued to decrease in the United States. Data from the U.S. World Health Organization (WHO) and National Respiratory and Enteric Virus Surveillance System (NREVSS) collaborating laboratories indicated a decline in activity for the fifth consecutive week; 17.0% of specimens tested positive for influenza this week. ILI data was similar to the previous week and above baseline for the thirteenth week this season. Fifteen states reported widespread influenza activity; 22 states reported regional influenza activity; nine states, New York City, and the District of Columbia reported local influenza activity; and four states reported sporadic influenza activity. The reporting of widespread or regional influenza activity decreased from 42 for week 10 to 37 for week 11. The percent of deaths due to pneumonia and influenza remained below baseline level.
Laboratory Surveillance*:
During week 11, WHO and NREVSS laboratories reported 3,632 specimens tested for influenza viruses, 616 (17.0%) of which were positive: 92 influenza A (H1) viruses, 59 influenza A (H3) viruses, 271 influenza A viruses that were not subtyped, and 194 influenza B viruses.
Since October 1, 2006, WHO and NREVSS laboratories have tested a total of 137,755 specimens for influenza viruses and 18,246 (13.2%) were positive. Among the 18,246 influenza viruses, 14,795 (81.1%) were influenza A viruses and 3,451 (18.9%) were influenza B viruses. Four thousand two hundred forty-seven (28.7%) of the 14,795 influenza A viruses have been subtyped: 3,325 (78.3%) were influenza A (H1) viruses and 922 (21.7%) were influenza A (H3) viruses. Among specimens tested for influenza during the most recent three weeks (February 25 ? March 17, 2007), on a regional basis, the percent of specimens testing positive for influenza were as follows:
February 25 – March 17, 2007 (specimens testing positive) | |
>20% positive | 10-20% positive |
East North Central (38.5%) | New England (15.7%) |
West North Central (20.1%) | Mid Atlantic (17.0%) |
East South Central (37.4%) | South Atlantic (15.4%) |
West South Central (25.0%) | Mountain (19.7%) |
| Pacific (13.2%) |
Although influenza A (H1) viruses have predominated in the US this season, the predominant virus has varied by region during the past three weeks. Influenza A has predominated in all but the East South Central region, where 77% of viruses reported from February 25 – March 17, 2007 were influenza B. However, within the eight regions where influenza A continues to predominate, A (H3) viruses have been more frequently reported than A (H1) viruses in the New England, Mid Atlantic, East North Central, and Pacific regions. Influenza A (H3) has accounted for 49% of the subtyped influenza A viruses in the West North Central region.
View Chart Data |ViewFull Screen
Composition of the 2006-07 Influenza Vaccine:
WHO has recommended that the 2007-08 trivalent influenza vaccine for the Northern Hemisphere contain A/Solomon Islands/3/2006-like (H1N1), A/Wisconsin/67/2005-like (H3N2), and B/Malaysia/2506/2004-like viruses. The influenza A (H1N1) component has been changed from the 2006-07 season vaccine components. A/Solomon Islands/3/2006 is a recent antigenic variant of the current vaccine strain A/New Caledonia/20/99. The influenza A (H3N2) and influenza B components remain the same. B/Ohio/1/2005 is antigenically equivalent to B/Malaysia/2506/2004. This recommendation was based on antigenic analyses of recently isolated influenza viruses, epidemiologic data, and post-vaccination serologic studies in humans.
Antigenic Characterization:
CDC has antigenically characterized 329 influenza viruses [200 influenza A (H1), 29 influenza A (H3) viruses, and 100 influenza B viruses] collected by U.S. laboratories since October 1, 2006.
Influenza A (H1) [200]Influenza A (H3) [29]? One hundred eighty-nine (95%) of the 200 viruses characterized were similar to A/New Caledonia/20/99-like, which is the influenza A (H1) component of the 2006-07 influenza vaccine.
? Eleven (5%) of the 200 viruses showed somewhat reduced titers with antisera produced against A/New Caledonia/20/99 and are similar to A/Solomon Islands/3/2006-like.
Influenza B (B/Victoria/02/87 and B/Yamagata/16/88 lineages) [100]? Thirteen (45%) of the 29 viruses were characterized as A/Wisconsin/67/2005-like, which is the influenza A (H3) component of the 2006-07 influenza vaccine.
? Sixteen (55%) of the 29 viruses showed somewhat reduced titers with antisera produced against A/Wisconsin/67/2005.
Victoria lineage [71]
? Seventy-one (71%) of the 100 influenza B viruses characterized belong to the B/Victoria lineage of viruses.Yamagata lineage [29]o Forty-two (59%) of these 71 viruses were similar to B/Ohio/01/2005, the B component of the 2006-07 influenza vaccine.
o Twenty-nine (41%) of these 71 viruses showed somewhat reduced titers with antisera produced against B/Ohio/01/2005.
? Twenty-nine (29%) of the 100 influenza B viruses characterized belong to the B/Yamagata lineage of viruses.
Pneumonia and Influenza (P&I) Mortality Surveillance*:
During week 11, 7.1% of all deaths were reported as due to pneumonia or influenza. This percentage is below the epidemic threshold of 7.8% for week 11.
Influenza-Associated Pediatric Mortality*:
Three influenza-associated pediatric deaths were reported during week 11. Since October 1, 2006, CDC has received 35 reports of influenza-associated pediatric deaths that occurred during the current season.
Influenza-Associated Pediatric Hospitalizations*:
Laboratory-confirmed influenza-associated pediatric hospitalizations are monitored in two population-based surveillance networks?: the Emerging Infections Program (EIP) and the New Vaccine Surveillance Network (NVSN).
During November 5, 2006 ? March 3, 2007, the preliminary laboratory-confirmed influenza-associated hospitalization rate for children aged 0-4 years old in the NVSN was 1.62 per 10,000.
During October 1, 2006 ? March 3, 2007, the preliminary laboratory-confirmed influenza-associated hospitalization rate reported by the EIP for children 0?17 years old was 0.49 per 10,000. For children aged 0-4 years and 5-17 years, the rate was 1.27 per 10,000 and 0.18 per 10,000, respectively.
Influenza-like Illness Surveillance*:
During week 11, 2.7%*** of patient visits to U.S. sentinel providers were due to ILI. This percentage is above the national baseline**** of 2.1%.
Five out of nine surveillance regions reported ILI above their region-specific baseline****:
Region | Reported ILI (%) | Region-Specific Baseline (%) |
New England | 2.4 | 1.2 |
Mid Atlantic | 2.4 | 2.6 |
East North Central | 2.5 | 1.9 |
West North Central | 1.4 | 1.5 |
South Atlantic | 2.4 | 2.3 |
East South Central | 1.9 | 2.4 |
West South Central | 4.8 | 3.0 |
Mountain | 2.4 | 1.7 |
Pacific | 2.9 | 3.2 |
ViewChart Data| View Full Screen
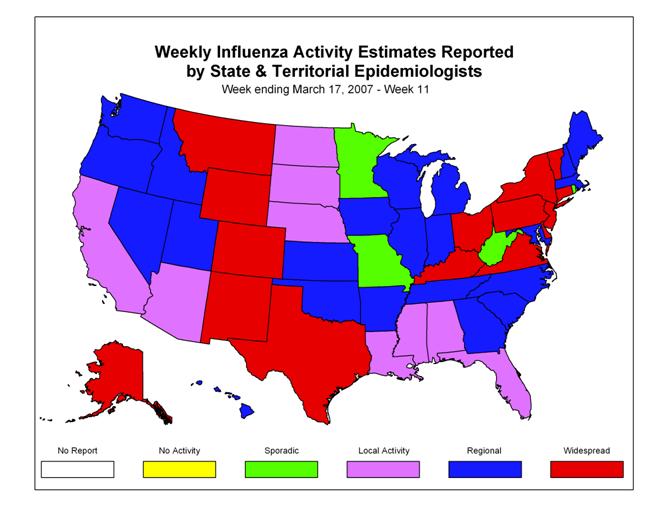
Influenza Activity as Assessed by State and Territorial Epidemiologists*:
During week 11, the following influenza activity?? was reported:
? Widespread activity was reported by 15 states (Alaska, Colorado, Connecticut, Delaware, Kentucky, Montana, New Jersey, New Mexico, New York, Ohio, Pennsylvania, Texas, Vermont, Virginia, and Wyoming).
? Regional activity was reported by 22 states (Arkansas, Georgia, Hawaii, Idaho, Illinois, Indiana, Iowa, Kansas, Maine, Maryland, Massachusetts, Michigan, Nevada, New Hampshire, North Carolina, Oklahoma, Oregon, South Carolina, Tennessee, Utah, Washington, and Wisconsin).
? Local activity was reported by New York City, the District of Columbia and nine states (Alabama, Arizona, California, Florida, Louisiana, Mississippi, Nebraska, North Dakota, and South Dakota).
? Sporadic activity was reported by four states (Minnesota, Missouri, Rhode Island, and West Virginia).
- USDA: Confirms Highly Pathogenic Avian Influenza (H5N1) in a Dairy Herd in Idaho 3 days ago
- China: A human case of avian influenza A(H9N2) reported in Yunnan Province 7 days ago
- Canada: Highly pathogenic avian influenza in Saskatchewan, May 15, 2026 9 days ago
- Canada: Highly pathogenic avian influenza in Alberta, May 16, 2026 10 days ago
- Norway: First detection of bird flu in polar bears in Svalbard 11 days ago
[Go Top] [Close Window]